
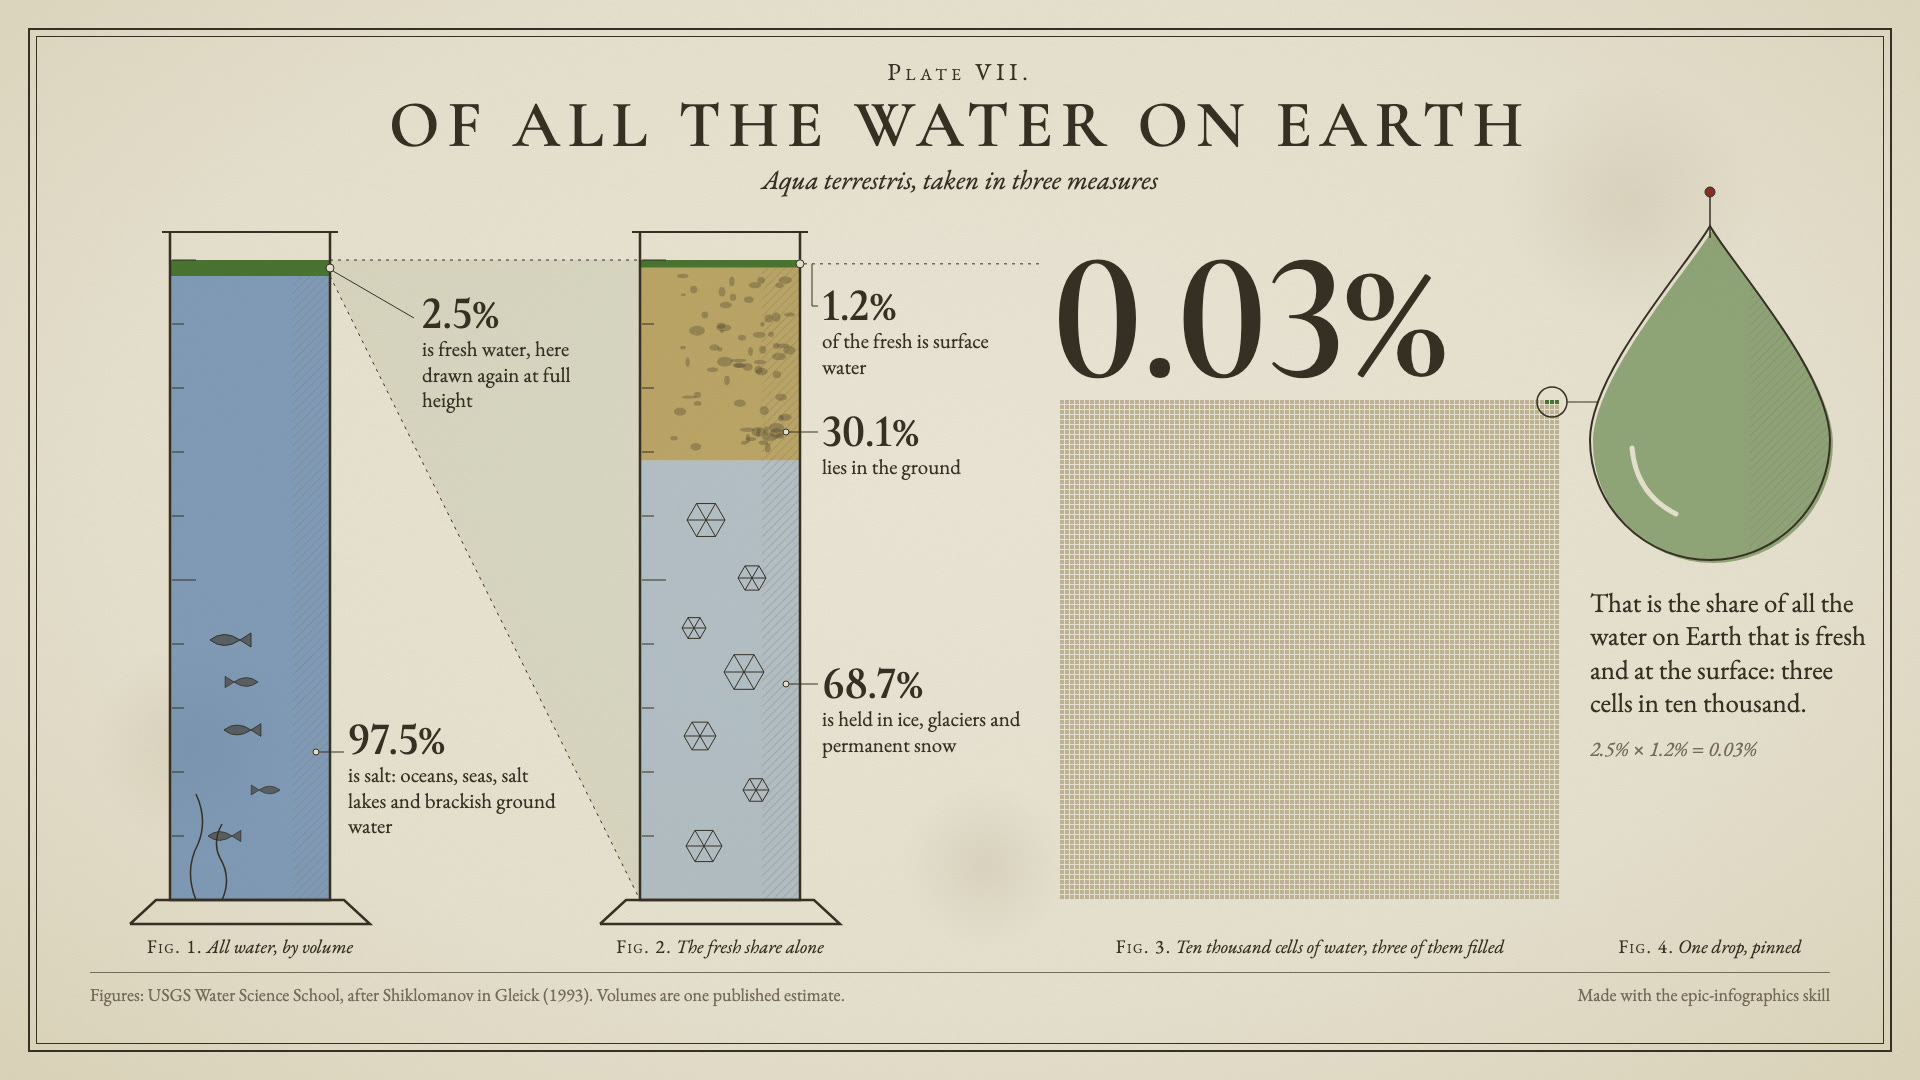
About this skill
Epic Infographics is an open-source skill by Or Ron. Your agent settles who the graphic is for, gathers the figures, pitches two or three story angles, and picks a drawn object that can carry the data, such as a jar filled to the real percentage. It writes one HTML page in one of twelve design languages, each with exact colors, fonts and rules. A script measures the page for colliding or clipped text before anything is rendered, the agent reviews its own PNG against a checklist, and a second script can turn the same page into an MP4 or GIF.
You say
Turn this table of our survey results into a square hand-drawn graphic for social. Use only these numbers, and also give me a short animated version.
How it works
- Your agent pins down the audience, the goal and where the graphic will live, then gathers the figures.
- It pitches two or three story angles and builds the winner around a drawn object that carries the data.
- It writes one HTML page in a single design language, and a script reports any text that collides or gets clipped, which the skill says to fix before rendering.
- It renders the PNG, looks at it against a checklist, and fixes what it finds before handing it over.
- If you asked for motion, it adds CSS animation to the same file and renders an MP4 or GIF, reviewing a contact sheet of frames.
Getting a good result
- Paste your numbers and say to use only those. The skill labels made-up values as illustrative, but it can still get researched figures wrong.
- Name the format and where it will run, such as a square feed post or an A4 printout, since the canvas drives the layout.
- Ask for motion only once the still looks right, because the animation ends on that same frame.
What you get
- The epic-infographics skill at a pinned commit, with its MIT license
- Twelve design languages with exact palettes, font pairings and do's and don'ts
- 30 ways to show data, with SVG chart recipes and the math written out
- A layout checker that reports colliding, clipped or undersized text
- Scripts that render a PNG in six sizes and an MP4 or GIF frame by frame
Good fit
- Social graphics, stats posters and print one-pagers from real figures
- Explaining how something works or where the numbers go
- Short animated data clips for feeds, stories and slides
Not for
- Charts that must update live or respond to a click
- Photographic or AI-generated images: everything is drawn in code
- Topics with no figures you can supply or check
How to install it
- Download the ZIP and unzip it.
- Inside the ZIP's top folder, move the epic-infographics folder that holds SKILL.md into your agent's skills folder, such as ~/.claude/skills/, and keep LICENSE and ATTRIBUTION.md with it. Then run npm ci && npx playwright install chromium inside it once.
- Start a new session and ask for what you want to make.
Needs: An agent that reads skills and can look at images, Node.js 20 or newer, Chromium from Playwright, An internet connection, for Google Fonts when rendering, FFmpeg, only for MP4 and GIF.
FAQ
Is it really free?
Yes. Create a free AdAnt account to download the ZIP. There is no card and no trial timer, and the original is public on GitHub, linked on this page.
Does it need an API key or the internet?
No key. Setup downloads Playwright from npm (and runs fsevents' install script on a Mac), and Playwright downloads Chromium from its own CDN. Every page the skill writes links its fonts from Google, so rendering and opening one contact fonts.googleapis.com and fonts.gstatic.com. If they can't be reached, the page falls back to other fonts with no warning, so check the PNG. The skill also tells your agent to research missing figures, using whatever web access your agent has. Run setup yourself, as the install note says: SKILL.md lists npm install and the Chromium download as first-time setup, and brew or apt for FFmpeg, without telling your agent to ask you first.
What does it run on my machine?
Three Node scripts. check.mjs and render.mjs start headless Chromium. animate.mjs starts Chromium and FFmpeg, or the program the FFMPEG environment variable names, and writes its frames to a temporary folder that it deletes afterwards. render.mjs and animate.mjs replace any file already at the output path without asking. We found no telemetry, analytics or uploads. The MP4s and GIFs have no sound.
Has AdAnt read all of it?
Yes, every file in the ZIP: SKILL.md, all references, all twelve design languages, the template and the three scripts. It is someone else's code, so read it before you trust it.
Is anything left out of the ZIP?
Everything outside the skill's own folder: the examples (66 files, 79 MB), the README, the contributing and security notes, a planning document, the plugin manifests, and the repository's own scripts and CI. The skill does not use them, and they stay public in the original repository. Every file we kept is unchanged.
Should I render a page I didn't write?
No. All three scripts open the HTML in Chromium with JavaScript on and no filter on what it loads, so someone else's page could run its own code in that browser and send requests to any address while it renders. SKILL.md tells your agent to link nothing but Google Fonts, but no script enforces that, and the layout checker doesn't look for it. Render only pages you or your agent wrote.
Do its styles imitate anyone?
Three of the twelve style files name a reference for their look. cutaway opens with a Dorling Kindersley / Stephen Biesty "Incredible Cross-Sections" plate, park-poster names the WPA posters and the modern Fifty-Nine Parks series, and isometric-world says "SimCity meets an explainer". Each aims for that kind of look with its own colors, fonts and rules, and none tells your agent to copy a specific picture. For commercial work, don't ask your agent to match those people's or companies' pieces or use their names in your prompts or credits, or pick one of the other nine styles.
Are the example's numbers right?
They come from one published estimate, on the USGS Water Science School page "Where is Earth's Water?" (Shiklomanov, in Gleick, 1993): 2.5% of Earth's water is fresh, and of that 68.7% is ice, glaciers and permanent snow, 30.1% is ground water and a little over 1.2% is surface water. The 97.5% and the 0.03% are our own arithmetic (100 - 2.5, and 2.5% x 1.2%). Read the 0.03% as a broad figure: in the USGS table, most of that 1.2% is ground ice and permafrost, and the same page puts rivers and lakes at about 1/150th of one percent of all water, near 0.007%. The graphic doesn't draw that line. It shows the format, so don't cite it as a source.
Are its quality claims proven?
We couldn't check all of them. The style files say their palettes pass color-blind checks, but the checker isn't in the repository, so we couldn't repeat that, and a few slots state contrast under 3:1 with a rule to always label them. Its notes on what audiences liked come with no data. The layout checker is real and measures text, not whether the numbers are right, so check every figure yourself.
Related skills
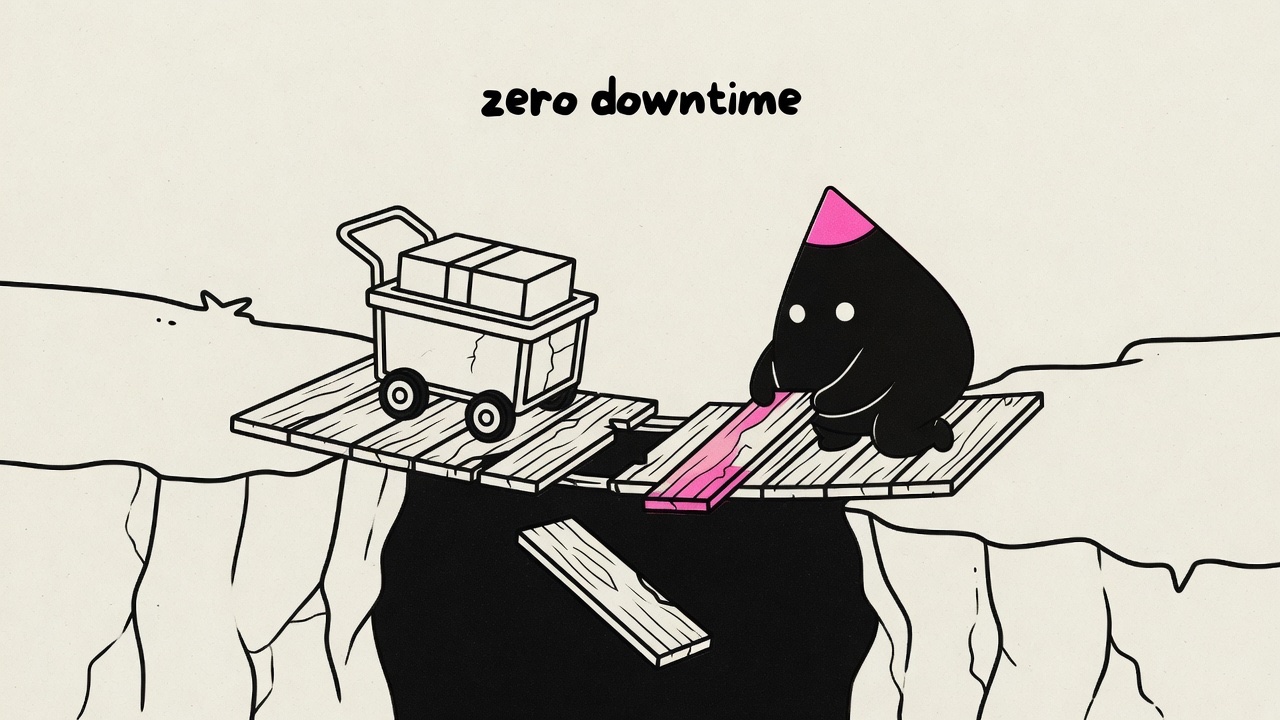
Illo: Editorial Illustrations With a Recurring Mascot
Have your agent turn one idea or an article into original print-style illustrations where a recurring mascot acts the idea out.
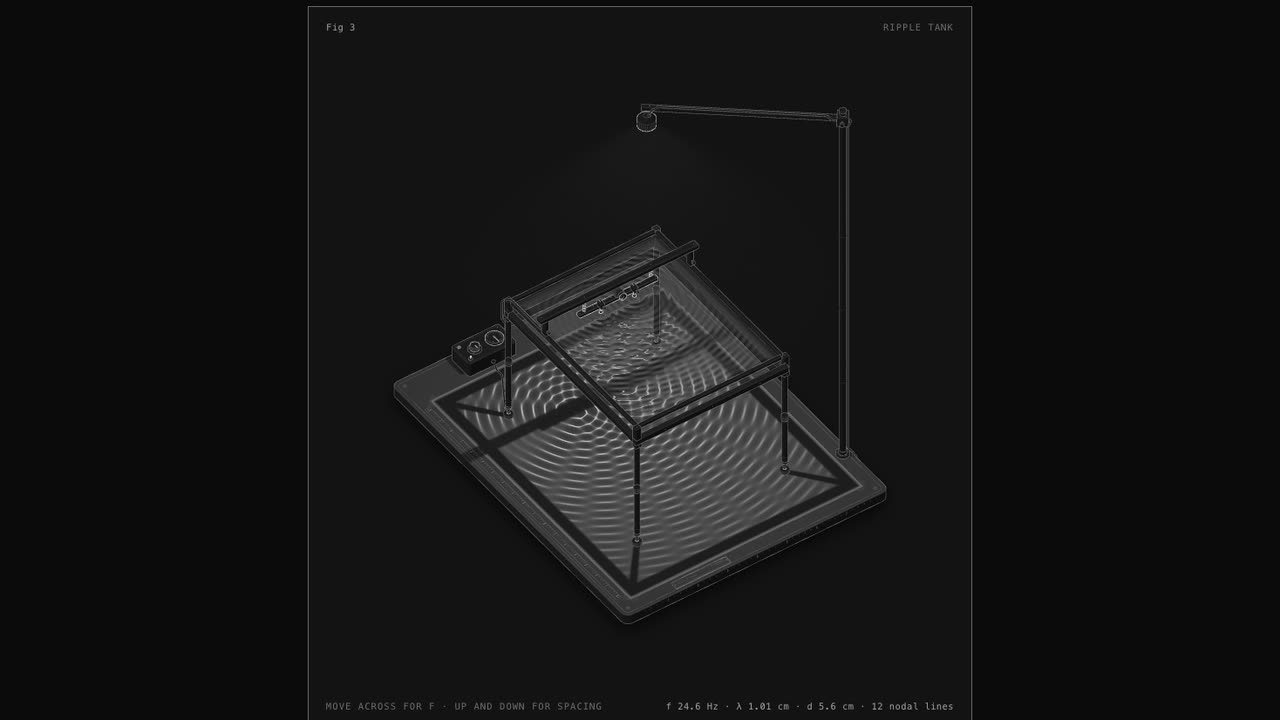
Anatomy: Interactive Isometric Figures That Explain an Idea
Have your agent explain a technical idea as a real machine, drawn as a detailed isometric figure that moves and shows live numbers.
HyperFrames: HTML to Video
Have Claude write launch films, explainers and title cards as HTML, then render them to MP4.